Beyond the Visible Spectrum: The Physics of Non-Contact Diagnostics

UNI-T UTi165A Unit Thermal Imager
In 1800, astronomer Sir William Herschel performed a simple experiment that changed physics forever. He passed sunlight through a prism to create a spectrum and measured the temperature of each color. He noticed that the temperature increased from violet to red. But when he placed a thermometer just beyond the red end of the spectrum—where there was no visible light—the temperature was highest of all.
Herschel had discovered "Calorific Rays," known today as Infrared Radiation. This discovery revealed a fundamental truth: our eyes are blind to the vast majority of the information surrounding us. Every object above absolute zero (-273.15°C) is essentially a light bulb, radiating energy in the infrared spectrum. The intensity and wavelength of this radiation are directly correlated to the object's temperature.
In the context of industrial maintenance and building diagnostics, this "invisible light" carries vital data. It allows us to perform non-contact diagnostics, assessing the health of a system without touching it, stopping it, or taking it apart.
Microbolometers: The Eye of the Sensor
How do we capture light we cannot see? The heart of a modern thermal imaging device is the Focal Plane Array (FPA), specifically the uncooled microbolometer.
Unlike a standard digital camera sensor (CCD or CMOS) that converts photons into electrons based on the photoelectric effect, a microbolometer works on the principle of thermal resistance. The sensor is comprised of thousands of microscopic pixels made of a material like Vanadium Oxide (VOx). These pixels are suspended in a vacuum to thermally isolate them from the rest of the chip.
When infrared radiation strikes a pixel, the pixel heats up. This change in temperature causes a measurable change in the electrical resistance of the VOx material. The camera's processor reads these resistance changes across the entire array 9 times per second (9Hz) or faster, constructing a thermal map of the scene. This ingenious engineering allows us to "see" temperature differences as small as 0.15°C (150mK), revealing subtle clues like moisture behind drywall or friction in a conveyor belt roller.
Interpreting the Thermogram: Ironbow vs. Rainbow
Because infrared light has no "color" in the human sense, the image produced (the thermogram) is a data visualization, not a photograph. The camera assigns visible colors to specific temperature values. This mapping is controlled by color palettes.
- Ironbow: This palette transitions from black/blue (cold) to purple/orange (mid) to yellow/white (hot). It is favored by electricians because it mimics the natural "glow" of heated metal, making it intuitive for spotting hotspots in fuse panels.
- Rainbow: This high-contrast palette uses the full visible spectrum. It is excellent for detecting subtle temperature gradients in building envelopes, such as missing insulation or drafts, where the temperature difference might be only a few degrees.
- Grey/Grayscale: Often the most detailed, this palette removes the distraction of color, allowing the eye to detect fine structural details and textures.
Understanding which palette to use is part of the physics of diagnostics. It is about maximizing the signal-to-noise ratio for the human eye.
Case Study: The Ruggedization of Optical Arrays
For years, the fragility of the microbolometer sensor kept thermal cameras in the laboratory. They were delicate, expensive, and required liquid nitrogen cooling. The revolution in the industry has been the development of robust, uncooled sensors packaged in housings that can survive the job site.
The UNI-T UTi165A exemplifies this engineering evolution. It packages a sensitive 120x90 infrared detector into a chassis designed for the rough-and-tumble reality of field work.
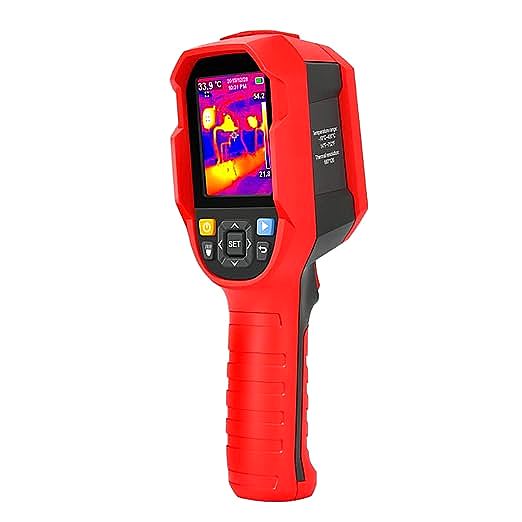
The device features a fast startup time and a simple "point-and-shoot" interface, removing the complexity barrier. Crucially, it includes High and Low Temperature Tracking. The software automatically places a cursor on the hottest and coldest pixels in the frame. This removes the guesswork; the operator doesn't have to hunt for the hotspot manually. The device mathematically identifies the thermal outlier instantly.
Furthermore, the integration of a 2.8-inch TFT display allows for immediate analysis. In the past, technicians had to record data and analyze it later on a PC. Now, the decision to shut down a machine or order a replacement part can be made standing right in front of the equipment.
The Economics of Prevention
The adoption of thermal imaging is driven by a simple economic equation: Predictive Maintenance (PdM) vs. Reactive Maintenance.
Reactive maintenance means fixing things after they break. This is the most expensive model, involving unplanned downtime, rush shipping for parts, and potential collateral damage (e.g., a seized motor burning out its controller).
Predictive maintenance uses non-contact diagnostics to monitor the condition of equipment while it is running. By detecting the thermal signature of a loose lug or a dry bearing weeks in advance, maintenance can be scheduled during planned shutdowns. The cost of a thermal imager like the UTi165A is often recouped by preventing a single hour of unplanned downtime.
Conclusion: The Sixth Sense
We are limited by our biology to a very narrow perception of the world. Technologies like infrared imaging do not just provide data; they expand the human sensorium. They allow us to perceive the flow of energy itself. Whether checking the thermal efficiency of a solar panel installation or ensuring the safety of a breaker box, thermal imaging provides the visual evidence needed to maintain the complex systems that power our modern lives. It turns the invisible physics of heat into a visible, actionable roadmap for reliability.